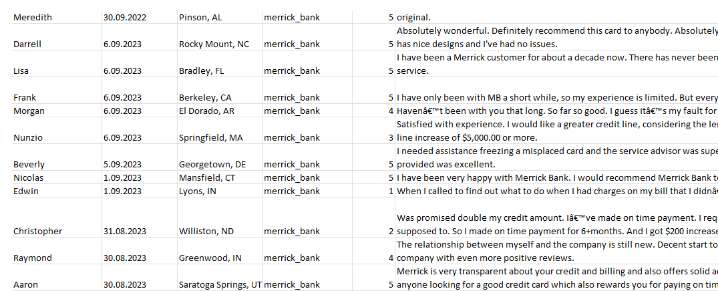
Here I have banking data in excel format. The excel file has 19272 rows. It is data where a customer has given a rating to the bank based on the service given by the bank.
Problem statement.
As a product manager or a product designer, I need to get insights. This research data serves as a valuable resource for gaining insights.
Initial Data Exploration:
To begin, we need to acquire data that reveals the following:
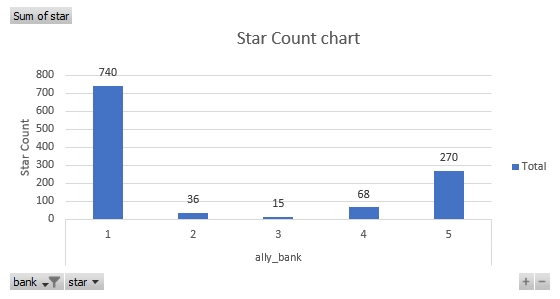
Ratings given by customers (ranging from 1 to 5 stars) to various banks. The frequency with which customers assign a 1-star rating to particular banks.
Convert data into charts for better understanding of the data.
The contains these columns
- Author
- Date
- Location of Author
- Bank Name
- Star Rating
- Text/ Feedback customer has given to the bank


